This example uses the phonTools package, developed by Santiago Barreda.
require(phonTools)
## A few examples of some vowel plots.

## load the Peterson and Barney data
data (pb52)
pb52 = pb52[pb52$type=='m',]  ## use only the males

# par (mfrow = c(3,2), mar = c(4.2,4.2,1,1))

# standard layout with linear axes
vplot (pb52$f1, pb52$f2, pb52$vowel, xsampa = TRUE)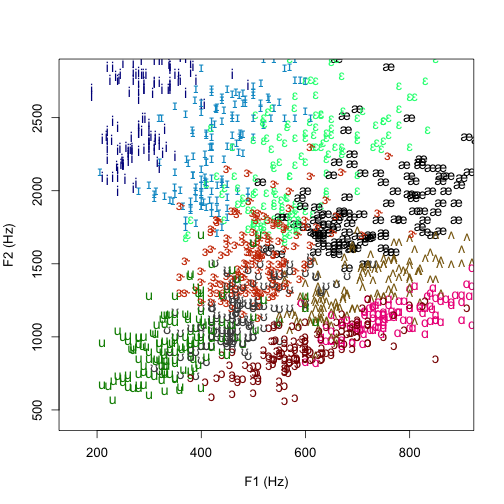
# alternate layout with log axes
vplot (pb52$f1, pb52$f2, pb52$vowel, logaxes = TRUE,
           alternateaxes = TRUE, xsampa = TRUE)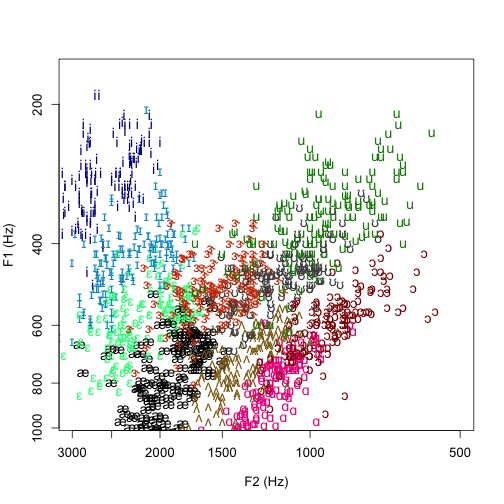
# category means only
vplot (pb52$f1, pb52$f2, pb52$vowel, logaxes = TRUE,
           meansonly = TRUE, xsampa = TRUE, cex = 3)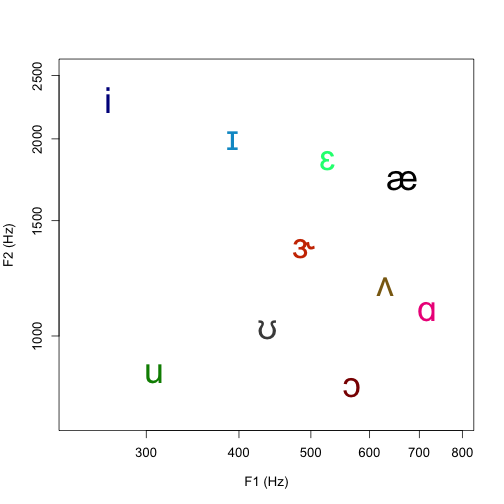
# category means only with standard deviation ellipses
vplot (pb52$f1, pb52$f2, pb52$vowel, logaxes = FALSE,
       meansonly = TRUE, ellipsesd = 2, xsampa = TRUE)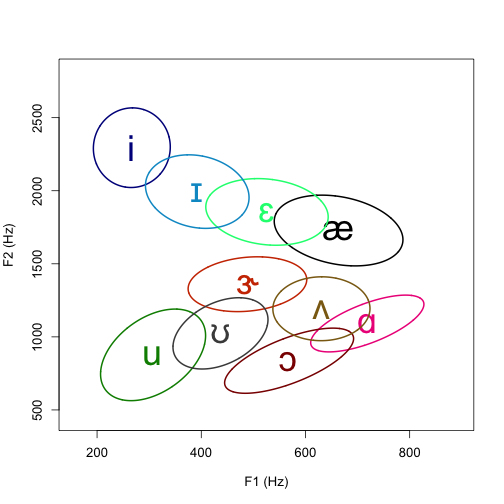
# same as above, with alternate axes
vplot (pb52$f1, pb52$f2, pb52$vowel, logaxes = TRUE,
       meansonly = TRUE, ellipsesd = 2, xsampa = TRUE,
	   alternateaxes = TRUE)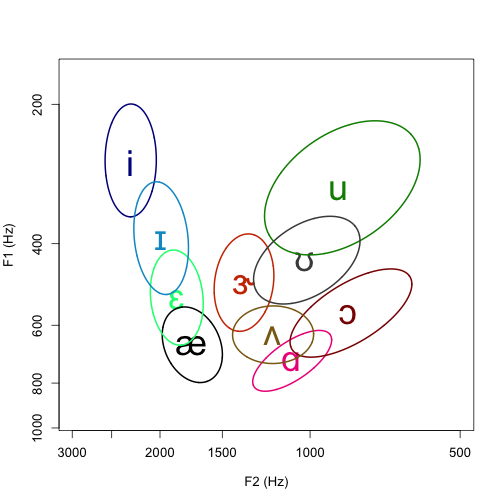
# individual points with standard deviation ellipses
# and alternate axes
vplot (pb52$f1, pb52$f2, pb52$vowel, logaxes = TRUE,
	   meansonly = FALSE, ellipsesd = 2, xsampa = TRUE,
	   alternateaxes = TRUE)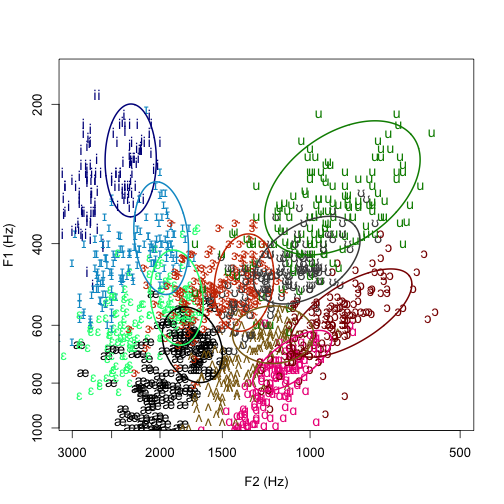
I have moved some of the files around and this is a further test of the workflow functionality. I am hoping to be out of the testing phase within a week or so and then I should be able to post in plain text from anywhere!